Article Text

Abstract
Objectives The primary objective of this analysis was to characterise the steady-state pharmacokinetics (PK) of ethinylestradiol (EE) and drospirenone (DRSP) in a randomised Phase III study that investigated the contraceptive efficacy and safety of three different regimens of EE 20 µg/DRSP 3 mg.
Methods Non-linear mixed-effects modelling was used to develop population PK models for EE and DRSP. EE and DRSP serum concentrations were determined in blood samples obtained from approximately 1100 healthy young women on two occasions during the first cycle (Week 3) and after 6 months (Week 27) of EE 20 µg/DRSP 3 mg use. EE 20 µg/DRSP 3 mg was administered as a flexible extended regimen [24–120 days’ active hormonal intake followed by 4 days with no tablet intake (tablet-free interval)], a conventional 28-day cyclic regimen (24 days’ active hormonal intake followed by 4 days of placebo tablets) or a fixed extended regimen (120 days’ uninterrupted active hormonal intake followed by a 4-day tablet-free interval) over 1 year.
Results The population PK of EE and DRSP in this population were successfully described using the developed population models. All three regimens led to similar steady-state drug exposure during long-term treatment. Only minor changes (≤8%) in the steady-state PK of EE and DRSP were observed between Week 3 and Week 27 of an extended regimen. Body weight (BW) and age had a small, statistically significant impact on the PK of EE and DRSP (BW only) in a covariate analysis, however, these changes were not considered to be clinically relevant.
Conclusions Extending the established 24/4-day regimen of EE 20 µg/DRSP 3 mg does not change the known steady-state PK of EE and DRSP, suggesting that the clinical efficacy is also similar. This is in line with the published clinical results from this study.
- Oral Contraceptives
This is an open-access article distributed under the terms of the Creative Commons Attribution Non-commercial License, which permits use, distribution, and reproduction in any medium, provided the original work is properly cited, the use is non commercial and is otherwise in compliance with the license. See: http://creativecommons.org/licenses/by-nc/3.0/ and http://creativecommons.org/licenses/by-nc/3.0/legalcode
Statistics from Altmetric.com
Introduction
The concept of reducing the frequency of menstrual bleeding (or, in the case of women using contraceptives, the frequency of withdrawal bleeding) for medical or personal reasons is appealing to many women.1–5 One option to achieve this goal is to use hormonal contraceptives in an extended-cycle or continuous regimen. Over recent years, numerous clinical trials have confirmed the efficacy, safety and generally good tolerability of extended or continuous-use hormonal contraceptives.6–10 Indeed, a 2005 Cochrane review (which was assessed as being up to date in 2009) came to the conclusion that continuous dosing of combined oral contraceptives (COCs) is a reasonable approach for women without contraindications to COCs.11 The pharmacokinetics (PK) of COCs in extended-cycle or continuous regimens, however, have not been studied in a large clinical study population.
The current analysis was undertaken to characterise the PK of ethinylestradiol (EE) and drospirenone (DRSP), the active compounds of established COCs such as 21/7-day regimen of EE 30 µg/DRSP 3 mg (Yasmin®) and 24/4-day regimen of EE 20 µg/DRSP 3 mg (YAZ®), when administered in an extended regimen. The analysis was part of a large randomised Phase III study that investigated the contraceptive efficacy and safety of three different regimens of EE 20 µg/DRSP 3 mg.6
Methods
Collection of PK samples and population PK analysis was planned as part of a large randomised trial that has undergone ethical review. The main objectives of this PK analysis were (i) to explore the steady-state PK of EE and DRSP during extended-cycle use of EE/DRSP on two different occasions, namely at the beginning of the study within the first cycle (Week 3) and after about 6 months of treatment (Week 27), (ii) to evaluate the effects of a number of pre-selected, potentially relevant covariates and (iii) to estimate individual drug exposure.
Subjects, drug administration and blood sampling
In a Phase III, multicentre, randomised, open-label, parallel-group efficacy and safety study (protocol number 308683; ClinicalTrials.gov identifier: NCT00266032) approximately 1100 healthy young women received EE 20 µg/DRSP 3 mg as a COC.6 The study subjects received one of three different cyclical regimens: a flexible extended regimen with management of intracyclic (breakthrough) bleeding (flexibleMIB); a conventional 28-day cyclic regimen; or a fixed extended regimen. In the flexibleMIB group, subjects received one EE 20 µg/DRSP 3 mg tablet per day for a flexible number of cycles (between three and 13). The minimum duration of active treatment in this group was 24 days (‘mandatory phase’). After the mandatory phase, the cycle could continue up to 120 days or until the subject experienced three consecutive days of breakthrough bleeding or spotting (‘flexible phase’), when they were advised to take a 4-day tablet-free interval (i.e. hormone-free interval). In the conventional regimen group, subjects received EE 20 µg/DRSP 3 mg once daily for 13 cycles (over 1 year). Each cycle comprised 24 days of active hormonal intake followed by 4 days of placebo tablets (as a hormone-free interval). In the fixed extended regimen group, subjects received EE 20 µg/DRSP 3 mg once daily for three cycles; each cycle comprised 120 days of uninterrupted active hormonal intake followed by a 4-day tablet-free interval. Intake of study medication was allowed either in the morning or evening, depending on personal preference. Safety, efficacy, demographic and medical data were collected as reported previously.6
To characterise the extended-cycle PK of EE and DRSP, four blood samples (7.5 ml each taken by direct venipuncture) were collected from all subjects participating in the study described above according to an optimised sparse sampling scheme, which was developed using the data of a previous multiple-dose PK study.12 Two samples each were collected during the first cycle (Week 3; Days 15–21) and after 6 months of treatment (Week 27). On both occasions, the first sample was collected upon arrival at the clinic/practice and the second sample within 45–120 minutes thereafter (actual sampling times ranged from 0–36 hours after the last dose for 99% of the samples). For each sample, the exact sampling time and the time of the preceding drug intake were recorded. Following collection in 9 ml serum monovettes or vacutainers without anticoagulant, blood samples were coagulated at room temperature for 20–30 minutes, before being centrifuged at 3000 rpm for 10 minutes. Serum supernatant was collected in labelled screw cap polypropylene tubes and stored at or below −20°C until bioanalytical determination.
Bioanalytical methods
EE concentrations were determined using a validated gas chromatography-mass spectrometry (GC-MS) method, which was similar to that previously described by Blode et al.12 For determination, EE was extracted from serum samples using toluene. The samples were back-extracted into dichloromethane, evaporated to dryness and derivatised using a one-step derivatisation procedure, before an aliquot was injected into the GC-MS system. Samples were analysed using mass selective detection in negative ions chemical ionisation mode with ammonia as reagent gas. The lower limit of quantification (LOQ) was 5.0 pg/ml; the inter-assay coefficient of variation ranged between 4.4% and 7.9% and the mean accuracy between 97% and 98%.
DRSP concentrations in serum were determined using a validated radioimmunoassay method as described by Blode et al.13 The LOQ was 0.10 ng/ml; the inter-assay coefficient of variation ranged between 6.1% and 8.0% and the mean accuracy between 88% and 94%.
Population PK analysis
The population PK analysis was conducted in accordance with the Food and Drug Administration (FDA) Guidance on Population Pharmacokinetics.14 In general, population-type PK models consist of three sub-models. The structural (sub-)model describes the relation between the administered dose of a drug and the changes in serum concentrations over time. The covariate (sub-)model describes the relation between a patient-specific characteristic (covariate) and the structural (population mean) PK parameter. The third (sub-)model is the stochastic model with two levels of stochastic (or random effect) model parameters that describe the variability between population mean estimates and observed concentrations.15 Population PK models for EE and DRSP were developed and fitted to the data by means of non-linear mixed-effects modelling using the NONMEM® software package (Version VI.2 level 2; Icon Development Solutions, Ellicott City, MA, USA). The first-order conditional estimates approximation with interaction was used for estimation. Graphical and statistical exploration of the data was performed using S-Plus® for Windows (Version 8.0 Professional, Insightful Corp., Seattle, WA, USA).
Population PK models for EE and DRSP were developed based on available models describing data from a Phase I PK study with 21-day administration of EE/DRSP.12 Based on the comparability of the study populations in terms of age and other demographic characteristics, it was assumed that the PK properties of both compounds in the current Phase III study population were similar to those in the previous Phase I study population.
The structural models of EE and DRSP were optimised by evaluating the presence of putative differences in PK between occasions. To this extent, clearance, central volume of distribution (V2) and bioavailability (F) were estimated separately per visit.
Covariate analyses were performed separately for the PK of EE and DRSP. Based on prior knowledge, it was decided to include age, body weight (BW), body mass index (BMI), and the influence of alcohol, smoking, ethnic group and concomitant medications (CYP3A4 inhibitors and inducers and acetaminophen) in the analysis. Data on age, BMI, BW, number of cigarettes and alcohol consumption were collected at both Week 3 and Week 27. Alcohol, smoking and concomitant medication use were included in the model only if reported in at least 10% of the population.
Covariate analysis was performed using a forward inclusion (p≤0.01) and backward elimination procedure (p≤0.001) in NONMEM.16 ,17
Individual exposure was calculated using the individual PK parameters estimated by the NONMEM model. Simulations were performed to show the influence of covariates on PK profiles. In addition, model-based simulations were used to illustrate the minimum and maximum steady-state DRSP concentrations to be expected with a flexible extended regimen of 72 days of active treatment (‘72/4-day flexibleMIB regimen’) as observed on average in the current clinical study,6 in comparison to the conventional 28 (24/4)-day cyclic regimen. For these simulations, maximum concentrations (Cmax) of DRSP were assumed to be reached at 1.4 hours after administration. Steady-state drug concentrations to be expected with an extended 72/4-day flexibleMIB regimen were simulated only for DRSP since comparable data for EE are available in the scientific literature.18
Results
Subjects and samples
Of the 1166 subjects randomised, a total of 1134 subjects received study medication; approximately 60% received the flexibleMIB regimen and about 20% each received the conventional and fixed extended regimens. The three groups were well matched for age and BMI.6
A total of 4218 EE samples (from 1109 subjects) and 4042 DRSP samples (from 1096 subjects) were submitted for PK analysis (Table 1). A few additional samples were excluded from the PK analysis (PK dataset) because the drug concentration was either below the LOQ or the amount of sample was insufficient for bioanalytical determination (<3% of all samples for EE and <1% of all samples for DRSP). Other reasons for exclusion of samples for EE were no dose time, no start date available and double cycle information, while for DRSP samples were also excluded if they were considered to be non-steady state serum concentrations.
Ethinylestradiol/drospirenone regimens and number of subjects per group
The median age of the subjects in the EE PK data set was 24 years, the median BW was 62 kg and the median BMI was 22 kg/m2 (Table 2). Similar results were observed in the DRSP PK dataset (data not shown). More than 98% of the subjects were Caucasian.
Descriptive statistics of the subjects who provided samples in the ethinylestradiol pharmacokinetic dataset (n=1109)
PK data analysis
Figure 1A shows the distribution of individual EE and DRSP concentrations versus time after the preceding dose. The number of samples taken in the absorption phase was relatively small. As neither visual inspection of the data nor the initial model development indicated any differences between treatment groups, it was decided to test the influence of the regimen as a covariate.

(A) Observed ethinylestradiol (EE) and drospirenone (DRSP) serum concentrations and (B) final models of EE and DRSP for population predicted (lines) and observed (circles) concentrations in young healthy women on different EE 20 µg/DRSP 3 mg regimens. In A, black circles: flexible extended regimen with management of intracyclic (breakthrough) bleeding (flexibleMIB; 24–120/4); dark grey triangles: fixed extended regimen (120/4); light grey quadrangles: conventional regimen (24/4). In B, Week 3, Days 15–21 of the first cycle with daily administration of EE 20 µg/DRSP 3 mg. Week 27: Days 15–21 of the seventh cycle in a 24/4 regimen, or Days 59–65 of the second cycle in a fixed extended regimen (120/4), or Week 27 in a flexible extended regimen (24–120/4). Database: 4218 EE and 4042 DRSP serum concentrations from 1109 and 1096 subjects. At both visits, two samples were taken from each subject 45–120 minutes apart.
The analysis of pre-selected covariates was limited to the variables age, BW, BMI and alcohol consumption. The effects of concomitant medication and smoking habits were not analysed because they occurred in <10% of the population; the effect of ethnic group was also not analysed as almost all subjects belonged to the same ethnic group. For all covariates evaluated, only minor changes between visits were observed. The covariates BW and BMI were normally distributed, and age showed a log-normal distribution (see Table 2 for descriptive statistics). No correlations between covariates were observed except for a strong correlation between BW and BMI.
Population PK of EE
The EE serum concentrations obtained in this study were best described by a three-compartmental model with first-order elimination and absorption [proportional error model; inter-individual variability (IIV) of clearance]. All parameters were estimated with good precision [relative standard errors (RSEs) ≤34%].
The estimated population mean value for apparent oral clearance was 25.3 l/hour based on a typical subject with median age of 24 years and median BW of 62 kg and the IIV of clearance was 33.4 CV%. The population PK parameter estimates for the final EE model are summarised in Appendix 1, and Figure 1B displays the time course of population predicted and observed EE serum concentrations.
Diagnostic plots showed a good agreement between predicted and observed values and no trend over time. The visual predictive checks demonstrated that the variability in EE serum concentrations can be adequately predicted by the final model as indicated by a continuous line well centred in the scatter of observed data points and dashed lines comprising approximately 90% of the observed data points (Figure 2).

Final models for ethinylestradiol (EE) and drospirenone (DRSP): visual predictive checks. Scatter = observed values; continuous line = predicted median; dashed line = predicted lower and upper limit of 90% of the predictions. Visit 3 = Week 3; Visit 5 = Week 27.
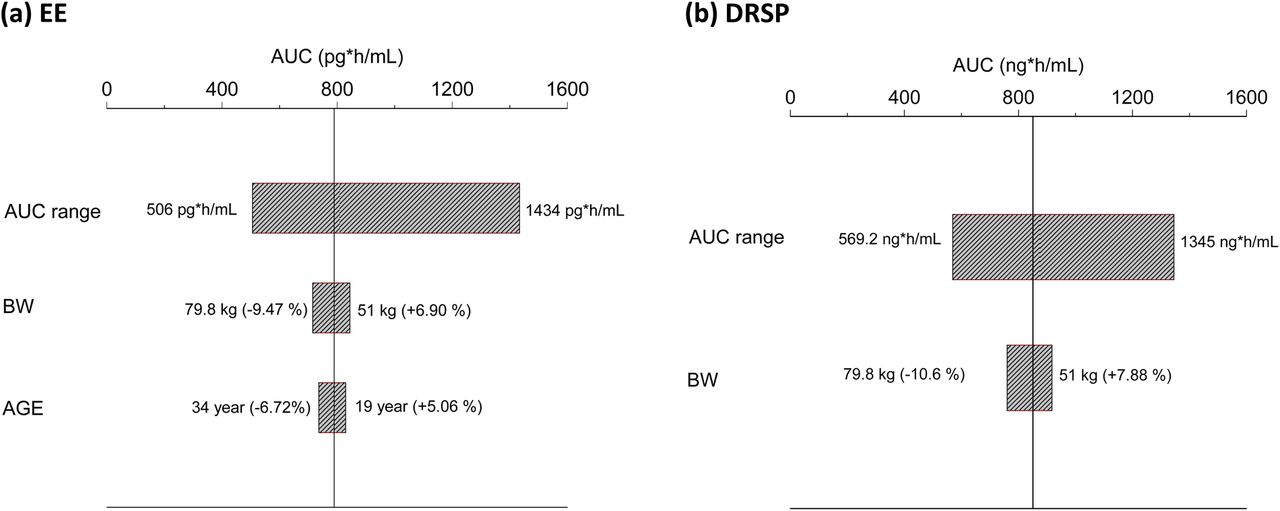
The oral (relative) bioavailability (F) was determined to be 8.15% higher in Week 27 compared with Week 3. BW was found to have a significant influence on clearance according to the criteria for covariate selection. Clearance increased by 0.591% per kilogram of BW. When translated into effects on exposure, this means that the typical systemic exposure associated with a BW at the upper end of the BW distribution (79.8 kg) was 15.3% lower than the exposure for a typical subject at the lower end of the weight distribution (51 kg) (Table 3). In addition, age was found to have an impact on clearance. Clearance increased by 20.8%/LNage (in which LN is the natural log). Translated into effects on exposure, this meant that the typical systemic exposure associated with an age at the upper end of the age distribution (34 years) was 11.2% lower than the exposure for a typical subject (i.e. ignoring the between-subject variability) at the lower end of the age distribution (19 years). In comparison to the overall variability in exposure [about 32%, expressed as the geometric coefficient of variation (geoCV)], the resulting difference in drug exposures for a typical subject and a subject at the lower or upper end of the weight or age distribution was small (below 10%) (Figure 3 and Table 4).
Influence of the covariates body weight and age on ethinylestradiol and drospirenone exposure
Descriptive statistics of the ethinylestradiol and drospirenone exposure expressed as the area under the drug concentration time curve from 0–24 hours at steady state (AUC0–24 h, ss)

Impact of the covariates body weight (BW) and age on ethinylestradiol (EE) exposure (A) and covariate BW on drospirenone (DRSP) exposure (B) in comparison with the overall distribution of individual EE or DRSP area under drug concentration time curves from 0–24 hours at steady state (AUC0–24 h, ss) in the study population. The AUC range between the 5th and 95th percentiles is shown as bars across the whole study population. The vertical line indicates the AUC value of a typical subject of median age (24 years) and weight (62 kg). Numbers in parentheses of the bars labelled with the covariate name indicate the deviation of the AUC value from the typical subject's value for the subjects at the 5th and 95th percentiles of the covariate distribution.
The comparison of the parameter value distributions of the final model including covariates and the base model without covariates revealed that the inclusion of BW and age explained in total only 0.9% of the variability [IIV and inter-occasion variability (IOV)].
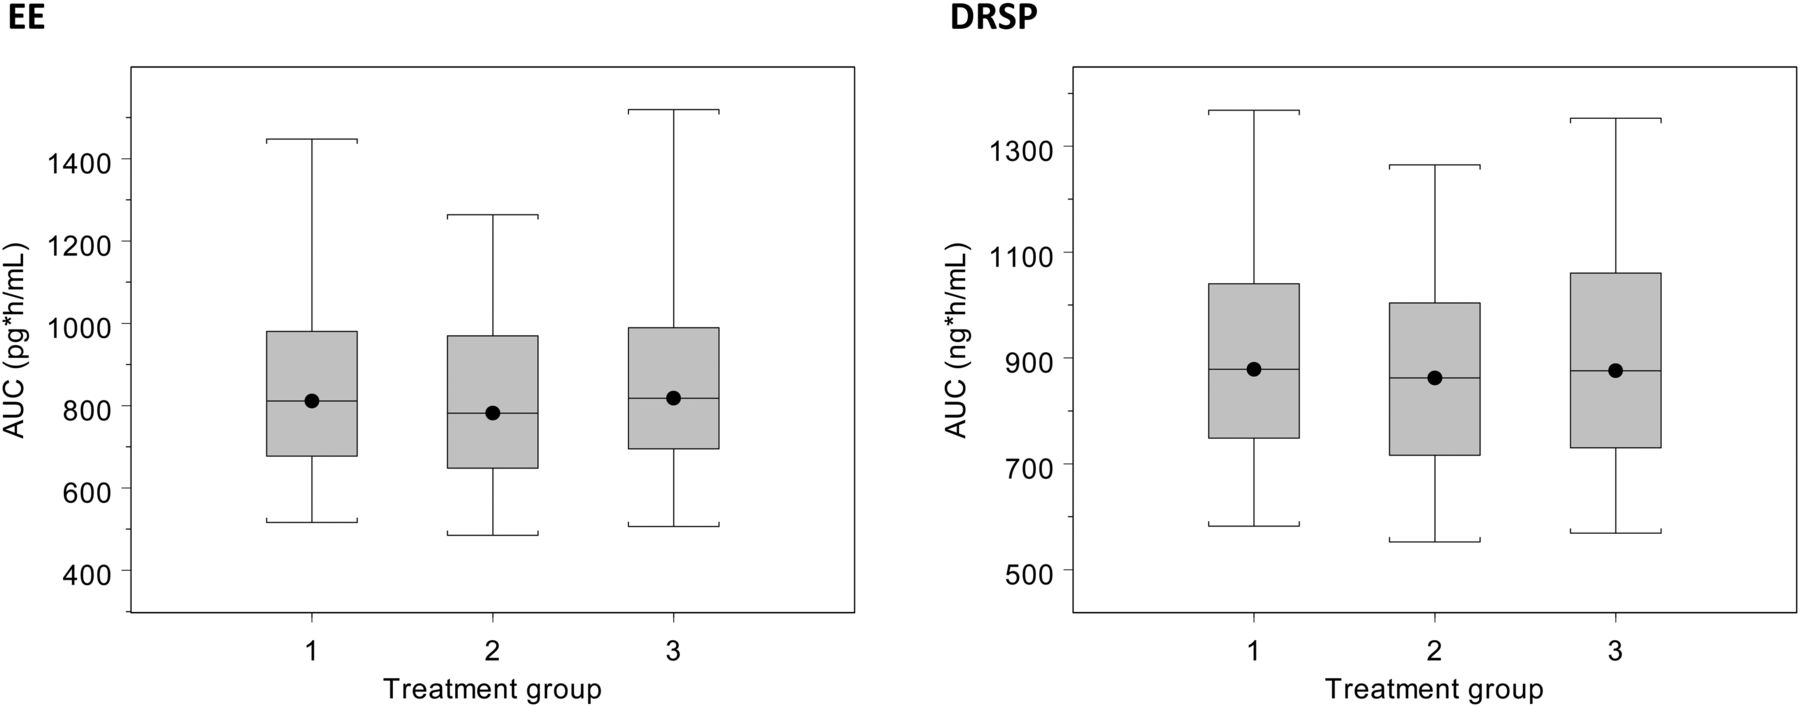
The range of exposure (area under the drug concentration time curve from 0–24 hours at steady state; AUC0–24 h, ss) observed for 90% of the study population was 505.6 to 1433.7 pg*hour/ml (median 808.2 pg*hour/ml). No marked differences in individual exposure were observed between the three regimens (Figure 4). The median EE exposure was 811, 818 and 782 pg*hour/ml in the flexibleMIB, conventional and fixed extended regimen groups, respectively. The decrease in the value of the objective function of only 3.032 points when ‘treatment group’ was included as covariate in the final model confirmed that there was no difference between the treatment groups.

Final models for ethinylestradiol (EE) and drospirenone (DRSP): distribution of the individual EE and DRSP exposure at steady state (AUC0–24 h, ss) by regimen. Group 1 = flexible extended regimen with management of intracyclic (breakthrough) bleeding (24–120/4); Group 2 = fixed extended regimen (120/4); Group 3 = conventional regimen (24/4). Black line with dot = median; box = range between 25th and 75th percentile; whiskers = 5th and 95th percentile.
Population PK of DRSP
The steady-state DRSP serum concentrations obtained in this study at Week 3 and Week 27 of EE/DRSP use were best described by a two-compartmental model with first-order elimination and absorption [proportional and additive error model; IIV of apparent clearance (CL/F) and bioavailability (F), IOV on bioavailability]. All model parameters were estimated with good precision, with RSEs of ≤26%.
The estimated population mean value for apparent oral clearance (Week 3) was 3.52 l/hour based on a typical subject with median BW of 62 kg. The IIV of clearance was 55.4 CV% and IIV of oral relative bioavailability was 47.6 CV%. The population PK parameter estimates for the final DRSP model are presented in Appendix 2. Figure 1B displays the time course of population predicted and observed DRSP serum concentrations.
Diagnostic plots showed a good agreement between predicted and observed values and no trend over time. The visual predictive check showed that the model adequately described the mean concentration-time profile and the variability of the data (Figure 2).
The oral clearance determined for Week 27 was 6.55% lower (l/hour) than the clearance determined for Week 3 (3.29 vs 3.52 l/hour).
BW was again found to have a significant influence on clearance according to the criteria defined for covariate selection. Clearance increased by 0.672% per kilogram of BW. DRSP data simulated by the final model showed that, translating this influence into effects on exposure, the typical systemic exposure associated with a BW at the lower end of the BW distribution (51 kg) was 17.2% higher than the exposure for a typical subject (i.e. ignoring both the between- and within-subject variability) at the upper end of the BW distribution (79.8 kg) (Table 3). In comparison to the overall variability in exposure (about 28%, expressed as geoCV), the resulting difference in drug exposures for a typical subject and a subject at the lower or upper end of the weight distribution was small (below 11%) (Figure 3 and Table 4).
The comparison of the parameter value distribution of the final covariate model and the base model revealed that BW explained in total only 1.2% of the between- and within-subject variability (IIV and IOV) in bioavailability (F).
The range in exposure observed for 90% of the study population was 569.2–1345.2 ng*hour/ml (median 874.1 ng*hour/ml). No marked differences in individual exposure were observed between the three regimens (Figure 4). The median DRSP exposure was 879, 876 and 862 ng*hour/ml in the flexibleMIB, conventional and fixed extended regimens, respectively. To evaluate the possible influence of the regimen, ‘treatment group’ was included as covariate in the final model; the decrease in the value of the objective function of only 1.256 points confirmed that there was no difference between the groups.
Orienting covariate analyses had indicated that alcohol consumption might have an effect on the central V2. However, the effect of alcohol consumption on DRSP exposure was found to be negligible in this study.
Simulation of DRSP concentrations to be expected with an extended 72/4-day flexibleMIB regimen
The final population PK model of DRSP was used to simulate steady-state DRSP serum concentrations to be expected with long-term administration of EE 20 µg/DRSP 3 mg according to an extended 72/4-day flexibleMIB regimen in comparison with the conventional 24/4-day regimen. The time courses of simulated minimum and maximum DRSP concentrations showed that (i) DRSP steady-state levels are expected to be the same with both regimens, (ii) the time to DRSP steady-state is not influenced by the length of the preceding treatment period and (iii) the DRSP level at the end of the 4-day hormone-free interval is independent from the duration of the preceding treatment period (Figure 5).

Minimum and maximum drospirenone concentrations to be expected with the conventional regimen (24/4) and an extended flexible 72/4-day regimen (simulated data).
Discussion
EE and DRSP concentration–time data collected in a large, long-term, randomised, Phase III study6 comparing the efficacy and safety of three different regimens of EE 20 µg/DRSP 3 mg were successfully used to develop population PK models for EE and DRSP. These models can be used to (i) evaluate the overall PK consequences of extending the active treatment period beyond the established duration of 21 or 24 days and (ii) provide measures of individual drug exposure.
The finding relevant for the above efficacy and safety study and for COC users and prescribers in general is that a flexible extended regimen of EE 20 µg/DRSP 3 mg was not associated with changes in the known steady-state PK of EE and DRSP. This supports the clinical results from the Phase III study, which demonstrated that the flexible extended regimen is an effective and well-tolerated COC that provides women with the ability to manage and extend their menstrual cycle from 28 days to 124 days.6 ,7 ,19 This regimen was also shown to significantly reduce the number of bleeding/spotting days and withdrawal bleeding episodes that women experience compared with the conventional 28-day regimen.6 ,19
In the present study, the oral (relative) bioavailability (F) of EE under steady-state conditions was determined to be 8% higher in Week 27 than in Week 3. This may reflect either a chance effect or an actual trend in time. The steady-state DRSP clearance in the present study was determined to be slightly lower (approximately 7%) in Week 27 than in Week 3. This may be a chance observation (a possibility that cannot be explored on the basis of the present data from only two visits), but it may also indicate minimal long-term accumulation of DRSP in addition to the known accumulation during the first days of intake. The latter possibility would be consistent with our previous study,13 which investigated the PK of EE 30 µg/DRSP 3 mg (in a 21/7-day regimen) using dense PK blood sampling methods undertaken at the end of cycles 1, 6, 9 and 13 in a Phase I study setting reporting data from 10 to 12 subjects (mean age and BW 24.2 years and 57.6 kg, respectively). The results of that study showed that steady-state DRSP serum concentrations increased slightly between treatment cycles 1 and 6 (12%; from 827 to 930 ng*hour/ml). Thereafter, the DRSP serum concentrations remained at the same level (957 and 968 ng*hour/ml at cycles 9 and 12, respectively). The same can be assumed for DRSP levels with extended EE/DRSP use beyond Week 27. No changes across cycles were observed for EE in that study (461, 346, 485 and 470 pg*hour/ml at cycles 1, 6, 9 and 12, respectively).
The present study clearly showed that the duration of active tablet intake has no effect on EE and DRSP exposure at steady-state (AUC0–24 h, ss). The median EE exposure observed was 811, 818 and 782 pg*hour/ml in the flexibleMIB, conventional and fixed extended regimen groups, respectively; the median DRSP exposure was 879, 876 and 862 ng*hour/ml.
Model-based simulations of steady-state EE and DRSP concentrations exemplified with an extended 72/4-day flexibleMIB regimen in comparison with the conventional regimen showed not only that EE and DRSP steady-state levels can be expected to be the same with both regimens, but also that the time to EE and DRSP steady-state is not influenced by the length of the preceding treatment period and that the EE and DRSP levels at the end of the 4-day hormone-free interval are not influenced by the duration of the preceding treatment period. DiLiberti and colleagues showed in a clinical study with extended-regimen administration of EE 30 µg/levonorgestrel (LNG) 0.15 mg that, based on dense PK sampling in 30 women, the Day 84 and Day 91 PK parameters of EE (and LNG) were similar to the Day 21 parameters.18 It should be noted that while the similar PK characteristics between conventional regimens and extended regimens may indicate comparable clinical efficacy, this does not necessarily indicate that the safety and bleeding profiles will also be comparable. However, as noted above, the flexibleMIB regimen has been shown to be well-tolerated and is associated with a reduced number of bleeding/spotting days and withdrawal bleeding episodes compared with the conventional 28-day regimen.6 ,7 ,19
In this study, covariate analyses revealed that BW and age had an impact on the PK of EE (BW and age) and DRSP (BW), which was significant according to the criteria defined for covariate analysis. However, the resulting differences in drug exposures for a typical subject were small (below 20%) relative to the observed overall variability in the PK of EE and DRSP.
The mean and median DRSP exposure (876 and 874 ng*hour/ml; 5th–95th percentile: 569.2–1345.2 ng*hour/ml) was in the same range as the values determined in previous Phase I studies with EE/DRSP combinations and the same dose of DRSP; 763 and 803 ng*hour/ml in Caucasian (mean age and BW 28 years and 63 kg; n=23) and Japanese (mean age and BW 27 years and 53 kg; n=24) women, respectively.12 For EE, the geometric mean and median exposure (AUC0–24 h, ss) observed in the present study across all three regimens was 822 and 808.2 pg*hour/ml (5th–95th percentile: 505.6–1433.7 pg*hour/ml), which was higher than the mean exposure observed in our previous Phase I studies with EE/DRSP combinations; 220 and 225 pg*hour/ml in Caucasian and Japanese women, respectively.12 The high variability of EE PK is well-known and substantial differences in the PK of EE in various localities have already been described over 30 years ago by Goldzieher and colleagues.20 Fotherby et al.21 reported a more than 10-fold variation in EE AUC values in a multicentre study. More recently, Goldzieher and Stanczyk22 commented on this variability pointing to differences in EE metabolism as a potential main reason. They also emphasised the high intra-individual variability observed by Brody et al.23 leading to almost four-fold different EE exposures within the same subject on different occasions. This variability is also reflected in the large range of absolute bioavailabilities (25–65%) reported in the literature.22 ,24 To put this into perspective, mean steady-state EE AUC0–24 values of 1778±479,25 776±30826 or 417±28927 pg*hour/ml were reported in different studies for COC products containing EE 20 µg combined with LNG 0.1 mg. Thus, differences in mean EE exposure across studies are a common phenomenon and are observed with different EE/progestin combinations. Differences in sample size as well as the documented high between-subject, between-occasion, and between- and within-centre variability in EE measurements may have contributed to these observations.
Conclusion
In conclusion, extending the established 28-day cyclic regimen for EE 20 µg/DRSP 3 mg to a flexible extended regimen does not change the steady-state PK of EE or DRSP. Steady-state PK were reached within the same time and to the same extent irrespective of the timing of the 4-day hormone-free interval. This suggests that the clinical efficacy is also similar and is in line with the published clinical results of this study.
Key message points
-
Extension of the established 24-day treatment period does not change the steady-state pharmacokinetics (PK) of ethinylestradiol (EE) or drospirenone (DRSP).
-
Steady-state PK are reached within the same time and resulted in the same minimum and maximum concentrations irrespective of the timing of the 4-day hormone-free interval.
-
The elimination rate of EE and DRSP does not alter with extended daily treatment up to 120 days.
Acknowledgments
The authors would like to thank Matthias Frei from Bayer HealthCare Pharmaceuticals for his excellent technical assistance, and C Hilka Wauschkuhn for providing medical writing services on behalf of Bayer HealthCare Pharmaceuticals. They also thank Simone Boniface and Clare Wheatcroft of inScience Communications, Springer Healthcare, who undertook a technical edit of the manuscript. This edit was funded by Bayer HealthCare Pharmaceuticals.
APPENDIX 1. Final model for ethinylestradiol
APPENDIX 2. Final model for drospirenone
References
Footnotes
-
Funding The Phase III and the Phase I studies with EE 20 µg/DRSP 3 mg described in this article were sponsored by Bayer HealthCare Pharmaceuticals, Berlin, Germany.
-
Competing interests S Reif is an employee of Bayer Pharma AG, Berlin, Germany; H Blode is an employee of Bayer HealthCare Pharmaceuticals, China; N Snelder is an employee of LAP&P Consultants BV, Leiden, The Netherlands, who provided modelling and simulation services for this Phase III study.
-
Provenance and peer review Not commissioned; externally peer reviewed.
-
Open Access This is an Open Access article distributed in accordance with the Creative Commons Attribution Non Commercial (CC BY-NC 3.0) license, which permits others to distribute, remix, adapt, build upon this work non-commercially, and license their derivative works on different terms, provided the original work is properly cited and the use is non-commercial. See: http://creativecommons.org/licenses/by-nc/3.0/