Article Text

Abstract
Objectives The objective of this study was to quantify the cost burden of unintended pregnancies (UPs) in Norway, and to estimate the proportion of costs due to imperfect contraceptive adherence. Potential cost savings that could arise from increased uptake of long-acting reversible contraception (LARC) were also investigated.
Methods An economic model was constructed to estimate the total number of UPs and associated costs in women aged 15–24 years. Adherence-related UP was estimated using ‘perfect use’ and ‘typical use’ contraceptive failure rates. Potential savings from increased use of LARC were projected by comparing current costs to projected costs following a 5% increase in LARC uptake.
Results Total costs from UP in women aged 15–24 years were estimated to be 164 million Norwegian Kroner (NOK), of which 81.7% were projected to be due to imperfect contraceptive adherence. A 5% increase in LARC uptake was estimated to generate cost savings of NOK 7.2 million in this group.
Conclusions The cost of UP in Norway is substantial, with a large proportion of this cost arising from imperfect contraceptive adherence. Increased LARC uptake may reduce the UP incidence and generate cost savings for both the health care payer and contraceptive user.
- long-acting reversible contraception
- health economics
This is an Open Access article distributed in accordance with the Creative Commons Attribution Non Commercial (CC BY-NC 3.0) license, which permits others to distribute, remix, adapt, build upon this work non-commercially, and license their derivative works on different terms, provided the original work is properly cited and the use is non-commercial. See: http://creativecommons.org/licenses/by-nc/3.0/
Statistics from Altmetric.com
Key message points
-
Unintended pregnancy (UP) in Norway generates substantial costs to the health care payer.
-
A large proportion of UPs is estimated to be attributable to imperfect contraceptive adherence, particularly amongst younger women who have high uptake of short-acting reversible contraception.
-
Increased long-acting reversible contraception uptake may reduce the incidence of UP and generate cost savings for both the health care payer and contraceptive user.
Introduction
Despite the wide availability of contraception in Norway, there is evidence to suggest high numbers of unintended pregnancies (UPs). Rates of abortion, one of the indicators of UP, are high in young women, with observed rates rising from 26.3 to 27.6 per 1000 women aged 15–24 years between 2001 and 2011.1 UP has been declared a public health issue in Norway by the Norwegian Directorate of Health in the ‘Action Plan for the Prevention of Unintended Pregnancies and Abortions 2010–2015’,2 and is likely to be associated with substantial health system costs. In general, contraceptive costs are borne out-of-pocket by contraceptive users. For women aged 16–19 years, oral contraceptives (OCs), patch and ring are reimbursed up to Norwegian Kroner (NOK) 416 (€50.7) per year. (NB. Conversion rates September 2014: £1=NOK 10.4; 1€=NOK 8.2).
Available methods of contraception are effective when used correctly (‘perfect use’); however, in practice incorrect and inconsistent method use (‘typical use’) results in diminished real-world effectiveness.3 Short-acting reversible contraception (SARC; comprising oral contraception, injection, ring and patch) is more reliant on user adherence, and thus has high typical use failure rates when compared to long-acting reversible contraception [LARC; comprising the implant, copper intrauterine device (IUD) and hormonal intrauterine system (IUS)]. [NB. Besides SARC and LARC methods, the analysis included barrier methods (using male condom as a proxy), withdrawal, calendar methods, and no method (chance)]. A previous study from a USA perspective indicated that rates of adherence-related UP were high in current practice and that shifting usage towards increased LARC uptake may result in reduced rates of UP and associated costs.4
In Norway, uptake of SARC or barrier methods is high in young women5 and may contribute to substantial numbers of potentially avoidable adherence-related UP. To date, there is no study quantifying the costs of UP and proportion due to imperfect contraceptive adherence in Norway. The current study reports the number and cost of UP outcomes estimated over a 1-year period in Norway, and explores potential cost savings that could be generated through increased LARC uptake.
Methods
Model structure
A previous study4 was used as the framework for the current analysis. A cost of UP model was constructed to estimate the number and costs of UP over an average 1-year period. The proportion of UP attributable to imperfect adherence and projected cost savings from a switch in contraceptive usage from SARC to LARC were also explored. Analyses were conducted from the societal perspective, accounting for direct and indirect costs incurred by both the health care payer and women using contraception. The analysis was limited to consideration of the costs of UP events only; longer term social and economic consequences of UP were not considered in the model.
Population
The model considered women aged 15–44 years requiring reversible contraception and at risk of pregnancy, divided into 5-year age groups to capture differences in pregnancy outcomes and contraceptive method use. Base case analyses were conducted in women aged 15–24 years, as this cohort represents a key target group for increased LARC uptake due to high current utilisation of SARC.5 This age group is also the focus of policy efforts in Norway to curb rates of UP and particularly abortions through use of more effective contraceptive methods.2
Number of UP events
To determine the number of UP events over an average 1-year period, four possible pregnancy outcomes were considered in the model: live birth, induced abortion, spontaneous abortion, and ectopic pregnancy, with the probability of outcome differentiated by age category. The annual number of live births was retrieved from national statistics data, as was the number of induced abortions.6 ,7 The number of spontaneous abortions was not reported directly in the literature; data on the incidence of spontaneous abortions in relation to induced abortions8 were used to calculate a ratio between the two, which was applied to the number of induced abortions to estimate the number of spontaneous abortions. The total number of ectopic pregnancies was obtained from diagnosis-related groups (DRG) case data9; age stratified figures were not available, hence USA data10 ,11 were used to determine the relative distribution of ectopic pregnancy events across age groups, and so estimate the number of events by age category.
To translate all pregnancy outcomes into estimates of UP only, proportions of 'unintendedness’ were applied to the data. For live birth and induced abortion these were obtained from an unpublished study by FE Skjeldestad (co-author; see Table 1), whilst proportions for spontaneous abortion and ectopic pregnancy were assumed with clinician input to be 0.5 for all age groups in the absence of available study data. The product of these and pregnancy events generated estimates of total UP outcomes. UP numbers were estimated for each 5-year age band included within the 15–44 years category.
Proportions of unintendedness of live birth and induced abortion, by age group
Costs of UP-related events
Costs associated with UP outcomes were derived using 2012 costs from the Norwegian Directorate of Health.9 ,12 Weighted average costs of pregnancy outcomes were estimated by multiplying the proportions of DRG-coded events occurring within each pregnancy outcome class by the corresponding DRG costs. For live births, a further summary weighted cost was calculated using the costs and relative incidence of vaginal versus caesarean deliveries. Calculated pregnancy outcome costs are presented in Table 2. Total UP costs were estimated by multiplying the numbers of each UP outcome by the corresponding outcome costs. The proportion of unintended births that were mistimed (versus unwanted) were adjusted for in scenario analyses by re-weighting the cost of a live birth, following a previously published methodology.13
Proportion of UPs due to imperfect contraceptive adherence
Contraceptive methods are associated with both ‘perfect use’ failure rates under trial conditions, and ‘typical use’ rates, reflecting contraceptive effectiveness in a real-world setting. The model included 11 reversible methods of contraception, comprising LARC (IUS, IUD, implant), SARC (OC, ring, patch, injection), barrier methods, calendar method, withdrawal, and no method (chance). The difference between perfect and typical use failure rates was assumed to be an appropriate proxy for imperfect adherence. The proportion of failures attributable to imperfect adherence was subsequently calculated for each method included in the analysis (Table 3).
To estimate the total proportion of UPs resulting from imperfect adherence, firstly contraceptive uptake distributions amongst all women in the included population were derived using data from the literature and the Norwegian Prescription Database.5 ,15 Reported distributions of use were re-weighted to account for reversible methods only. The proportion of women expected to incur a UP was then determined by multiplying method uptake percentages by typical use method failure probabilities. To determine the probability of an adherence-related UP, these were further multiplied by the method-specific probabilities of UP due to imperfect adherence.
Dividing the total proportion of women expected to have an adherence-related UP by the total proportion of women expected to have any UP generated an estimate of the overall proportion of UP predicted to result from imperfect adherence. This proportion was multiplied by total UP costs to determine the contribution from imperfect adherence.
Cost of contraception
The number of women using each of the contraceptive methods considered in the model was determined by first establishing the total number of women in the Norwegian population for each of the included age groups.16 Only women at risk of pregnancy and using reversible contraception were eligible for inclusion in the model; to refine the model population to include only this group, the proportion considered not at risk was removed (i.e. women who were pregnant, postpartum, seeking pregnancy, sterilised, no intercourse), using a combination of USA and Norwegian data.5 ,17 The resulting population was then multiplied by the contraceptive uptake distribution to allocate patients across each contraceptive method.
Ingredient costs for each contraceptive method included in the model were retrieved from electronic databases18 ,19 (Bayer, data on file). The number of units of each contraceptive method required in a year was assumed using Summary of Product Characteristics information and the literature.20
Contraceptive medical consultations were also captured. It was assumed that all LARC methods were associated with an insertion consultation, one follow-up consultation, and a removal consultation. For SARC (excluding injection) it was assumed that in an average year of use there was half a consultation, representing a consultation visit on average every other year. In line with standard practice in Norway, this assumes that a general practitioner (GP) consultation is not required for every refill prescription. Injection was assumed to be associated with four administration consultations per year, one of which was assumed to also encompass product prescription. Device fittings and method administration for LARC were assumed to be performed by a GP, gynaecologist or nurse. The proportions of IUD/IUS and implant fittings conducted by a GP versus a gynaecologist were obtained from another unpublished study by FE Skjeldestad. For injections, an equal split between GP and nurse administration was assumed due to a lack of published evidence, though the proportion of prescriptions prescribed, stratified by health care practitioner, was obtained from the unpublished study by FE Skjeldestad mentioned earlier.
To permit comparability between contraceptives with differing durations of use, total contraceptive costs were annualised. For SARC, product ingredient unit costs and consultation costs were multiplied by the respective number of each required in a year of product use. For LARC, the costs of a single product unit and total number of consultations incurred over the product lifetime were divided by the respective durations of product use. Total costs for each method and annualisation factors are presented in Table 4.
Total direct cost and total annualised direct cost, by contraceptive method
Total contraceptive costs at the population level were estimated as the product of the number of women using each method and the corresponding costs.
Indirect costs
Indirect costs were limited to consideration of days lost from work. For each possible UP outcome, a duration of time lost from work was assumed in conjunction with clinician input. Live birth was expected to fall under maternity leave and therefore was not included. Induced abortion, spontaneous abortion and ectopic pregnancy were assumed to be associated with three, two and four work days lost, respectively. Contraceptive consultations for insertion, removal and follow-up, respectively, were each assumed to elicit 0.25 days of lost work time. The assumed duration of time lost for each UP outcome and contraceptive consultation was multiplied by age-specific weighted mean daily earnings for women in Norway, calculated using data from Statistics Norway.21 Women aged 15–19 years were not included in the indirect cost calculation; it was assumed that the majority of women within this age group would not be in paid employment.
Cost savings from a switch from SARC to LARC
To explore the impact of increased LARC uptake, 5% of women aged 15–24 years using SARC methods in the model were allocated to LARC. SARC users were redistributed in proportion to baseline uptake of included LARC methods. The proportion of women expected to incur a UP under current contraceptive utilisation was calculated by multiplying contraceptive uptake distributions by the corresponding failure rates for each method. This was compared to the projected proportion of women estimated to incur a UP assuming a 5% switch, and the percentage change in predicted UP incidence.
The calculated percentage reduction in UPs following the 5% switch to LARC was multiplied by the base case estimate of total UP costs to determine possible UP-related cost savings. The cost impact of the modified contraceptive utilisation was also considered by comparing total contraceptive costs before and after the switch. One-way sensitivity analysis (OWSA) was conducted to evaluate the robustness of projected cost savings to a standard 30% variation in the value of parameters likely to be key model drivers, including population, efficacy, medical cost and resource use parameters. An exploratory analysis modelled the potential impact of all women aged 15–24 years using SARC switching to LARC.
Scenario analyses exploring the impact of lower typical use method failure rates, using non-annualised costs, and a break-even analysis were also undertaken (see online Supplementary Material for full methodology details).
Results
Number and cost of UPs
In the target age group of women aged 15–24 years, a total of 11 443 UPs were estimated, generating total costs of NOK 144 million (€18.0 million),22 of which NOK 133 million (€16.5 million) were direct and NOK 11.6 million (€1.5 million) were indirect costs. In the broader 15–44 years age group, 39 131 UPs and associated costs of NOK 617 million (€77.1 million) were estimated, of which NOK 568 million (€70.8 million) were direct and NOK 49.8 million (€6.2 million) were indirect costs. Total costs by age group are presented in Table 5. Applying an adjustment factor to account for the proportion of births that were mistimed rather than unwanted, total costs of UP amounted to NOK 72 million (€9.0 million) in women aged 15–24 years, and to NOK 346 million (€43.2 million) in women aged 15–44 years.
Total unintended pregnancy costs and proportion due to imperfect adherence, by age group
Proportion of UPs due to imperfect adherence
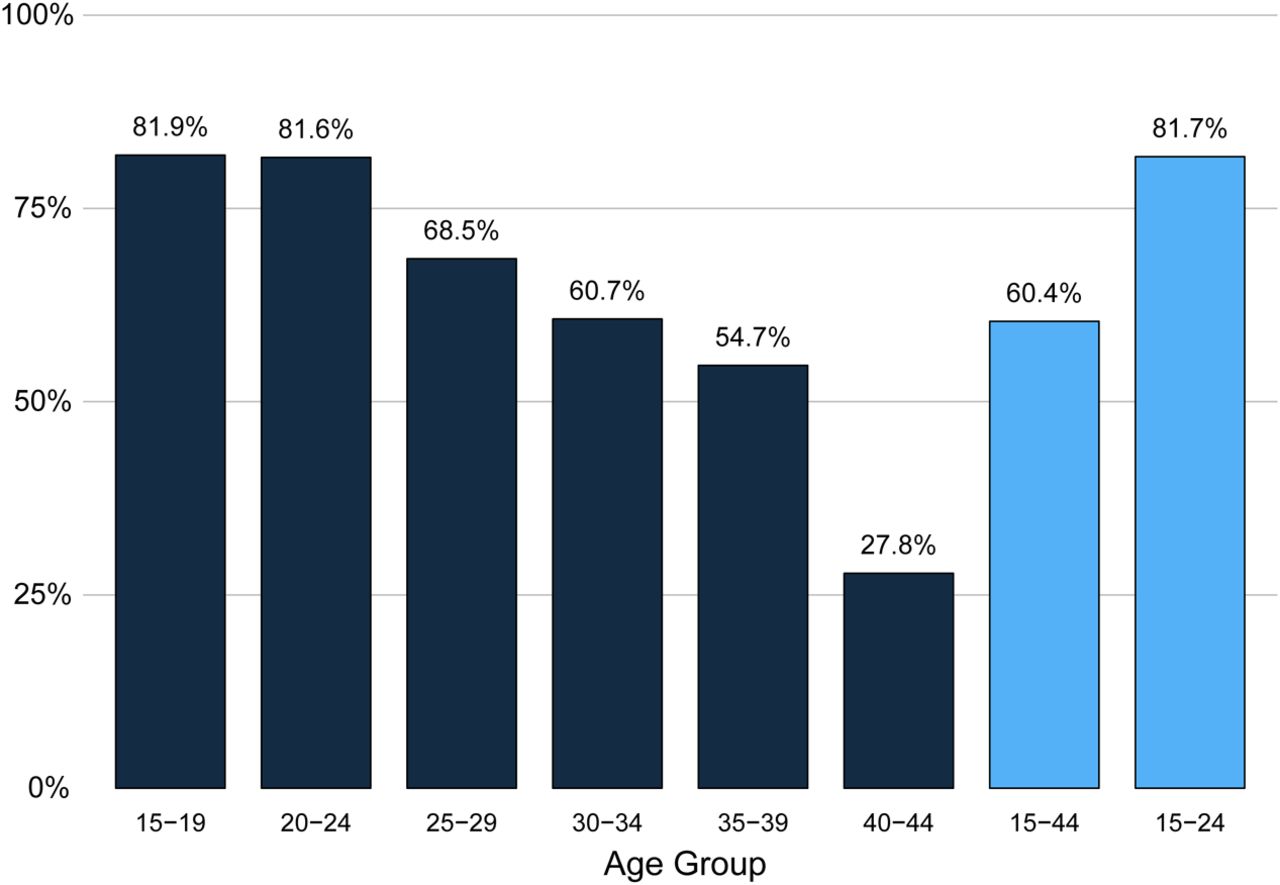
Imperfect adherence was estimated to account for 81.7% of UPs in the 15–24 years age group, the largest proportion amongst all age groups considered in the model (Figure 1). The cost contribution of adherence-related UP in this group was estimated to be NOK 118 million (€14.7 million) (Table 5). The proportion of UPs attributable to imperfect adherence in the 15–44 years group was estimated to be 60.4%, pertaining to costs of NOK 398 million (€49.7 million).

Proportions of unintended pregnancies attributable to imperfect adherence, by age group.
Cost of contraception
The estimated cost of contraception in the 15–24 years group was NOK 135 million (€16.8 million), and NOK 437 million (€54.6 million) in the 15–44 years group. Accounting for both the cost of UP and contraceptive use, total average annual costs incurred in Norway are projected to amount to NOK 279 million (€34.8 million) for women aged 15–24 years, of which NOK 254 million (€31.6 million) were direct costs and NOK 25 million (€3.1 million) were indirect costs. Of the direct costs, NOK 154 million (€19.2 million) were borne by the public health care payer and NOK 100 million (€12.4 million) by out-of-pocket payments by contraceptive users. Total average annual costs in all women aged 15–44 years amounted to NOK 1.06 billion (€131.6 million), of which direct costs were NOK 899 million (€112.2 million) and indirect costs were NOK 156 million (€19.5 million). Of the direct costs, NOK 589 million (€73.5 million) were borne by the public health care payer and NOK 316 million (€39.4 million) by out-of-pocket payments by contraceptive users.
Impact of a switch from SARC to LARC methods
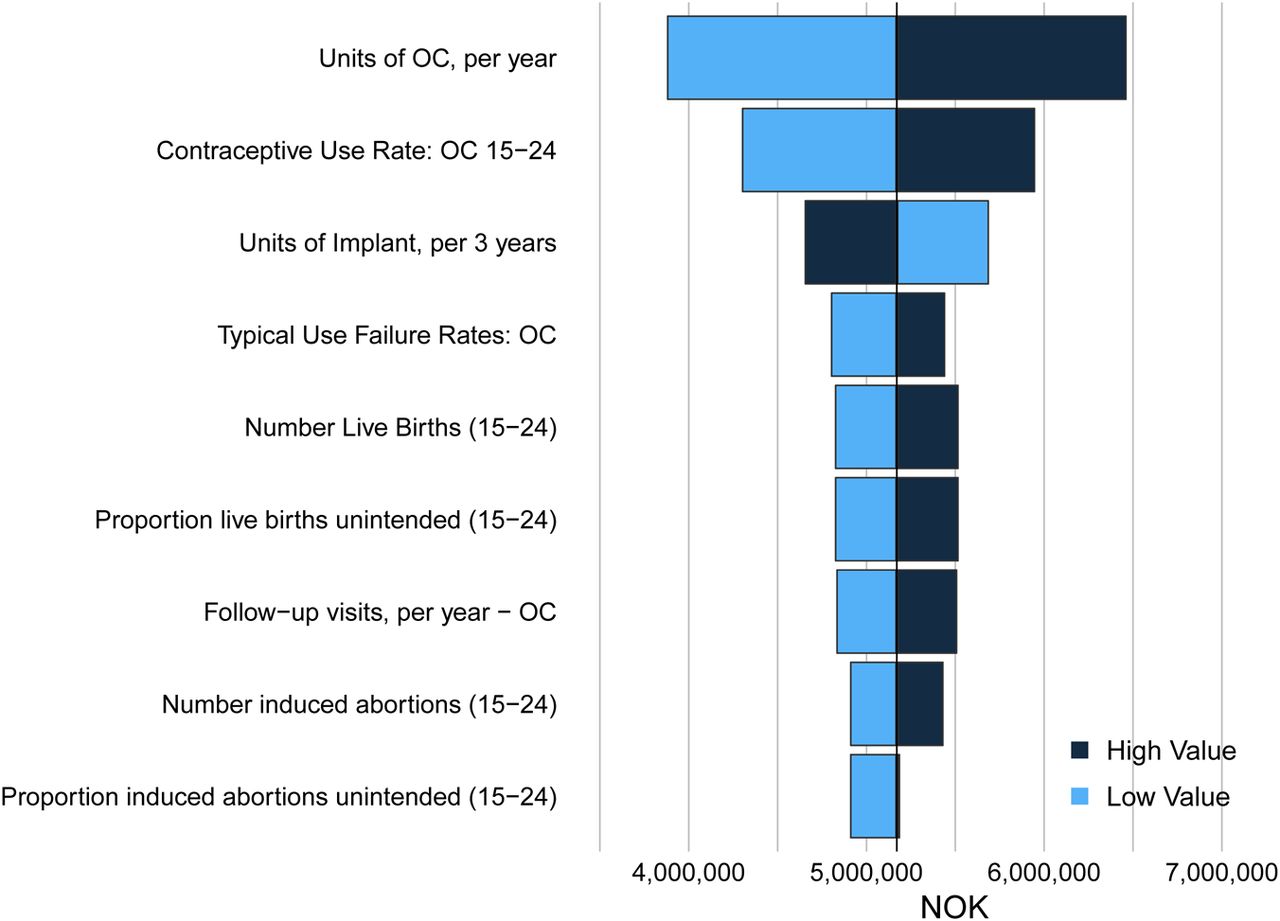
A 5% switch from SARC to LARC yielded expected cost savings of NOK 6.5 million (€815 000) in the 15–24 years age group, a 2.34% reduction in costs. OWSA indicated that cost savings were maintained across all parameter values tested (Figure 2). Increasing the proportion of women switching from SARC to LARC to 10% generated projected cost savings of NOK 13 million (€1.6 million), whilst a hypothetical scenario in which all women switched from SARC to LARC generated projected costs savings of NOK 131 million (€16.3 million), representing a 47% reduction in costs.
One-way sensitivity analysis results for cost savings post-5% switch from short-acting reversible contraception to long-acting reversible contraception. NOK, Norwegian Kroner; OC, oral contraceptive.
Reduced typical use failure rates
A scenario analysis exploring the impact of typical use method failure rates lowered by 30% revealed cost savings of NOK 6.3 million (€787 000) following a 5% switch from SARC to LARC in women aged 15–24 years, equivalent to a reduction of 2.26%. The total cost of UP due to imperfect adherence was estimated to be NOK 108 million (€13.5 million).
Non-annualised costs and break-even analysis
Using non-annualised LARC costs resulted in a projected cost increase of NOK 9.9 million (€1.2 million) in women aged 15–24 years following a 5% switch from SARC to LARC. Cost neutrality analysis indicated that LARC use was required for 1.28 years to generate a net cost impact of zero.
Discussion
This study demonstrates that UP represents a substantial economic burden in Norway, contributing to total costs of NOK 617 million (€77.1 million) in women aged 15–44 years, and NOK 144 million (€18.0 million) in women aged 15–24 years. Approximately 10% of these costs were indirect, demonstrating the extent of potential productivity loss associated with UP. Our results further indicate that a large proportion of total costs is attributable to imperfect adherence, and thus potentially avoidable. Of all women evaluated in the model, the largest proportion of UP attributable to imperfect adherence was estimated to be in the target group of women aged 15–24 years. In line with this finding, our analysis suggests that a 5% switch from SARC to LARC in women aged 15–24 years yields a substantial reduction in costs associated with UP outcomes, generating savings of NOK 6.5 million (€815 000). Whilst the majority of direct costs (63%) were projected to be borne by the public health care payer, a substantial proportion (37%) was projected to be incurred out-of-pocket by the contraceptive user due to contraceptive product costs. Cost savings through increased LARC uptake are thus likely to reduce the cost burden faced by both women and the national health care payer.
Despite higher upfront costs, cost neutrality analysis indicated that LARC methods on average require use for 1.28 years before cost savings are generated following a switch from SARC to LARC. Given that LARC methods have a minimum of 3-year duration of product efficacy, it is reasonable to assume that potential cost savings from increased LARC uptake would be realised.
In Norway, LARC usage rates among young women remain low despite a recent increase in uptake of LARC methods in all women requiring contraception in Norway.2 An experimental scheme investigated the impact of expanding current regulation and offering free contraception including LARC to women aged 20–24 years. It observed a significant increase in uptake of hormonal contraception in general and LARC methods in particular, as well as a significant decline in the incidence of abortions in the intervention population.23 Further promoting LARC uptake in younger women may help to realise the cost savings from both UP and contraceptive use predicted in our model.
There are a number of limitations to the analysis. USA data were used to calculate the proportion of women at risk of pregnancy, given a lack of data specific to Norway. Similarly, contraceptive failure rates used in the model were taken from studies in the USA. As typical failure rates have been shown to be higher in the USA compared to European populations,24 the proportion of UP attributable to imperfect adherence may have been overestimated. Nonetheless, scenario analyses using reduced method failure rates continued to generate substantial cost savings following a switch. Only first-year contraceptive failure rates were available, which may be higher than in subsequent years of use. Consequently, the estimated number of UP as well as cost savings generated from switching to LARC methods may be overstated.
Only costs of pregnancy outcome events were included in the model; prenatal costs and other social/economic costs of UP were not modelled. Additionally, side effects and the impact of contraceptive discontinuation and switching were not considered in the model and warrant additional research. In the absence of published evidence, clinician input was used to estimate the proportion of spontaneous abortions and ectopic pregnancies that were unintended. Exclusion of the 15–19 years age group when calculating indirect costs may have resulted in a slight underestimate of the true cost burden, given that a small proportion of women within this age group is likely to be employed, and thus incur productivity losses from work days missed. Finally, longer-term outcomes of pregnancy were not considered for this study, which focuses solely on short-term costs associated with the pregnancy event as well as associated contraceptive use.
Despite the above limitations, this analysis highlights the significant economic burden stemming from UP in Norway, and indicates that a substantial proportion of these costs are attributable to imperfect adherence. In women aged 15–24 years, an increase in the uptake of LARC methods could precipitate cost savings benefiting both the health care payer and contraceptive users. This provides an economic rationale to support potential legislation extending reimbursement of all methods of contraception to young women.
Acknowledgments
The authors would like to thank Kajsa Olsson for her valuable input during the preparation of this manuscript.
References
Supplementary materials
Supplementary Data
This web only file has been produced by the BMJ Publishing Group from an electronic file supplied by the author(s) and has not been edited for content.
Files in this Data Supplement:
- Data supplement 1 - Online supplement
Footnotes
-
Funding This study was funded by Bayer Pharma AG.
-
Competing interests Nathaniel Henry, Max Schlueter and Julia Lowin are full-time employees of IMS Health (a company providing information and technology services to stakeholders within the health care industry), who served as paid consultants to Bayer Pharma AG during the development of this study and manuscript. Ingrid Lekander was a full-time employee of Bayer AB during the development of this study and manuscript. Anna Filonenko is a full-time employee of Bayer Pharma AG. James Trussell and Fin Egil Skjeldestad have received honoraria for consultancy work performed for Bayer Pharma AG.
-
Provenance and peer review Not commissioned; externally peer reviewed.
Linked Articles
- Highlights from this issue