Article Text

Abstract
Objectives: To undertake a systematic review to obtain estimates of genital Chlamydia trachomatis prevalence in various populations in the United Kingdom and Ireland; to determine which populations have the highest rates of infection; and to explore the most important determinants of infection.
Methods: Electronic databases were searched using the keywords “chlamydia” and “England,” “Wales,” “UK,” “Scotland,” “Ireland,” or “Britain.” Additional unpublished data and references were solicited from experts. Studies were included in the analysis if C trachomatis prevalence was reported, and if they met inclusion criteria. Nine variables identified as potentially important descriptors of chlamydia prevalence were extracted from each study and analysed using various logistic regression models. Only studies reporting prevalence in female populations were included in the models, because there were few data from males.
Results: 357 studies were identified using the search methods, 90 of which met inclusion criteria, and 19 of which contributed to the final model. The most influential variables on prevalence were age and setting of the population tested. In general practice surgeries, the under 20 year old age group had an estimated prevalence of 8.1% (95% CI 6.5 to 9.9), 20–24 year olds 5.2% (95% CI 4.3 to 6.3), 25–29 year olds 2.6% (95% CI 2.0 to 3.3), decreasing to 1.4% (95% CI 1.0 to 1.9) in those aged over 30 years. Overall, healthcare settings had higher prevalence estimates than population based studies. For example, among under 20 year olds, estimates were 17.3% (95% CI 13.6 to 21.8) in genitourinary medicine clinics, 12.6% (95% CI 6.4 to 23.2) in antenatal clinics, 12.3% (95% CI 9.8 to 15.3) in termination of pregnancy clinics, 10.7% (95% CI 8.3 to 13.8) in youth clinics, 10.0% (95% CI 8.7 to 11.5) in family planning clinics, and 8.1% (95% CI 6.5 to 9.9) in general practice, compared to 5.0% (95% CI 3.2 to 7.6) in population based studies. The type of test, specimen used, date, and location of test were not strongly associated with chlamydia prevalence.
Conclusion: The chlamydia prevalence estimates by age and setting from the model may be used to inform chlamydia screening strategies. The systematic review revealed much heterogeneity in the studies identified, but with clear patterns of prevalence. It also indicated gaps in the knowledge about chlamydia prevalence in certain subgroups such as men and the general population.
- FPC, family planning clinic
- GP, general practice
- GUM, genitourinary medicine
- TOP, termination of pregnancy
- chlamydia
- prevalence
- systematic review
- United Kingdom
Statistics from Altmetric.com
- FPC, family planning clinic
- GP, general practice
- GUM, genitourinary medicine
- TOP, termination of pregnancy
Chlamydia trachomatis is the most common sexually transmitted infection diagnosed in genitourinary medicine (GUM) clinics in the United Kingdom.1 Most acute infections in males and particularly females are asymptomatic but, if untreated, the infection may progress to severe complications. The National Strategy for Sexual Health and HIV for England has highlighted the need to screen and treat asymptomatic infection.2 A chlamydia screening programme is being implemented in phases across England offering opportunistic chlamydia testing in select healthcare settings.3 Robust estimates of chlamydia prevalence are essential to help determine which population subgroups should be screened to maximise screening effectiveness as the programme is rolled out nationally. Estimates of chlamydia prevalence from studies conducted throughout the United Kingdom vary considerably.4,5 There has been no comprehensive systematic review of chlamydia prevalence ever undertaken in the United Kingdom, although a recent article on chlamydia prevalence in asymptomatic women in Europe has been published.6 The most recent comparisons of data and overviews of chlamydia prevalence in the United Kingdom were published in 1998 or earlier,7,8 were not done systematically, have excluded the largest, most recent studies, or have focused on prevalence in limited settings.9–11
Of the various chlamydia prevalence studies done in the United Kingdom, there has been considerable heterogeneity in methodologies used, making interpretation and comparison difficult. However, statistical methods are available to explore these differences. Some of the factors that might influence the overall prevalence include test setting and date, geographical location, type of diagnostic test and specimen, the age group and sex of those tested, sexual behaviour, and presence of symptoms. This study aimed to identify all studies on chlamydia prevalence in the United Kingdom including unpublished studies, explore which factors are the most important factors affecting prevalence estimates, estimate the prevalence for various populations, and explore which populations have the highest rates of infection.
METHODS
Study identification
Electronic databases (Medline via PubMed (from 1966), EMBase (from 1980), Web of Science–Science Citation Index and Social Sciences Citation Index (from 1981), SIGLE—System for Information on Grey Literature in Europe (from 1980) and HMIC: DH Data, Health Management Database) were searched using the keyword “chlamydia” with one of the following: “England,” “Wales,” “UK,” “Scotland,” “Ireland,” or “Britain” for studies published up to July 2002. References from chlamydia reviews were also searched. To reduce the effects of publication bias, a letter was sent to a selection of experts in the field who had published recently on chlamydia prevalence, requesting additional published or unpublished data, and names of researchers who might have additional information. Thirty letters were sent in total, with 22 responses with information received (73% response rate).
Exclusion criteria
Studies were included in the systematic review if a specific UK population was tested for C trachomatis, and if the number of people tested and positive was reported. A study was excluded from the analysis if it:
-
reported on prevalence in neonatal or prepubescent populations
-
selected populations of chlamydia positive individuals (that is, for follow up, diagnostic comparability or treatment outcomes, etc)
-
reported only prevalence among partners
-
recruited only individuals with symptoms (urethral/vaginal discharge, abdominal pain, etc)
-
estimated chlamydia prevalence in individuals with another infection
-
used serology for diagnosis.
Data extraction
Nine variables were extracted from each study. These were (coded categories in parentheses): date of testing (before 1985, 1985–90, 1990–5, 1995–2000, after 2000, other, unknown), diagnostic test (nucleic acid amplification (LCR/PCR/TMA), antigen (EIA/ELISA/DFA/MIF), culture, mixture of tests/other, unknown), specimen collected (urine, cervical/endocervical swab, urethral swab, mixture of specimens, other, unknown), sex (female, male, both, unknown), age (<20 years old, 20–24 years old, 25–29 years old, 30+ years old, other, unknown), setting of test (general practice (GP) surgery/community clinic, family planning clinic (FPC), termination of pregnancy (TOP) clinic, GUM clinic, population based/postal survey, youth clinic, antenatal clinic, other, unknown), number of individuals tested, number of positive individuals, and study ID. If a study reported disaggregate results (that is, prevalence in males and females, multiple age groups, various settings, etc), these were reported as separate “observations,” each one comprising a population with the same characteristics of extracted variables. These observations were then expanded to give individual records, each representing a person within each combination of age group, sex, setting, etc. These patient level data were treated as such in the regression analyses. When a variable did not fit into one of the specified groups, it was coded as “other.” Data from many studies were collected over several years, and longitudinal studies were coded in the appropriate band when possible. Similarly, there was no way of standardising age data in the studies extracted. Age classes were defined to include the greatest number of studies, while providing meaningful results on the difference in prevalence by age. Classification by the age bands listed was chosen instead of computing the mean or median age, as the age stratification was unknown for most studies. The setting of attendance/testing (and not reason for attending) was recorded.
Geographical location was extracted from each study and is included in the appendix (see STI website, www.stijournal.com). However, it was dropped from the regression analysis, but did not appear to be associated with C trachomatis positivity. Information on patient selection and the proportion who accepted a test offer was also extracted (appendix), but not used in the model. The proportion of individuals tested with symptoms might influence the prevalence, since symptomatic individuals may be more likely to appear in clinical settings. It was extracted from the studies but was not included in the analysis because of problems comparing this variable across studies. Similarly, sexual behaviour is also thought to be an important determinant of prevalence, but very few studies included this information and it was not included in the data extraction or analysis.
After applying exclusion criteria to the studies identified in the systematic review, there was still variation in the completeness and quality of the extractable data from the remaining studies. While some studies included details about selection of study participants or population sampled, others did not. Papers were not graded for quality, and it was not used as an exclusion criterion per se if all other criteria were met.
Statistical analysis
The data were analysed using Stata version 8. The prevalence and 95% confidence interval (CI) of each observation was computed using an exact binomial method.12 A weighted average of prevalence by setting for all studies was computed.
Logistic regression methods were used to explore the effect of the explanatory variables on prevalence. In the regression models, observations and their extracted patient level data were included if all of the variables were specified—that is, if there was no coding of “unknown” or “other.” For the analysis, data from females and males were explored separately, as these were considered to be separate populations with separate indicators of prevalence. Since there were few data from men, a separate regression analysis was not performed, but the prevalence (and 95% CI) was computed.
For females, logistic regression analysis was used to assess the association between each explanatory variable (setting, test, specimen, age group, date, location, sex) and the outcome, observed prevalence. A mixed effects model was fitted via Gauss-Hermite quadrature using the xtlogit command in Stata, which treated all variables as fixed except for study ID, which was treated as a random effect. While it is well recognised that variable selection can introduce biases into the analysis, a backwards elimination of those explanatory variables that were apparently unimportant variables (p>0.05 likelihood ratio test) was performed in order to maximise the number of observations in the model. The quadchk command was used to check the stability of the likelihood and parameter estimates. Interactions between the explanatory variables were explored.
A random effects meta-analysis was also performed. An arcsine square root transformation of the prevalence of each subgroup was performed which had an approximate Gaussian distribution with a standard deviation of 1/(2* (n0.5)). This was used as an estimate of the within study standard deviation in the meta command within Stata. The meta-analysis was done for females by age group and setting. Estimates of the prevalence and 95% CIs for the different subgroups were obtained from the mixed effects model and the meta-analysis. Results from the meta-analysis were back-transformed to provide an estimated prevalence and 95% CI. A sensitivity analysis was done to assess the impact of the larger studies. Observations with populations of over 1000 individuals were dropped from the data and the mixed effects model rerun. However, age and setting remained the only explanatory variables that were associated with the prevalence.
RESULTS
Study identification
A total of 357 studies were identified in the literature search for consideration in the analysis; 90 (27%) met the inclusion criteria and were included in the analysis, one of which was unpublished (see appendix for a description of the studies and extracted variables). The included studies comprised a total of 149 430 individuals tested for chlamydia, subdivided into 255 observations (that is, different combinations of age, sex, setting, etc).
Description of included studies
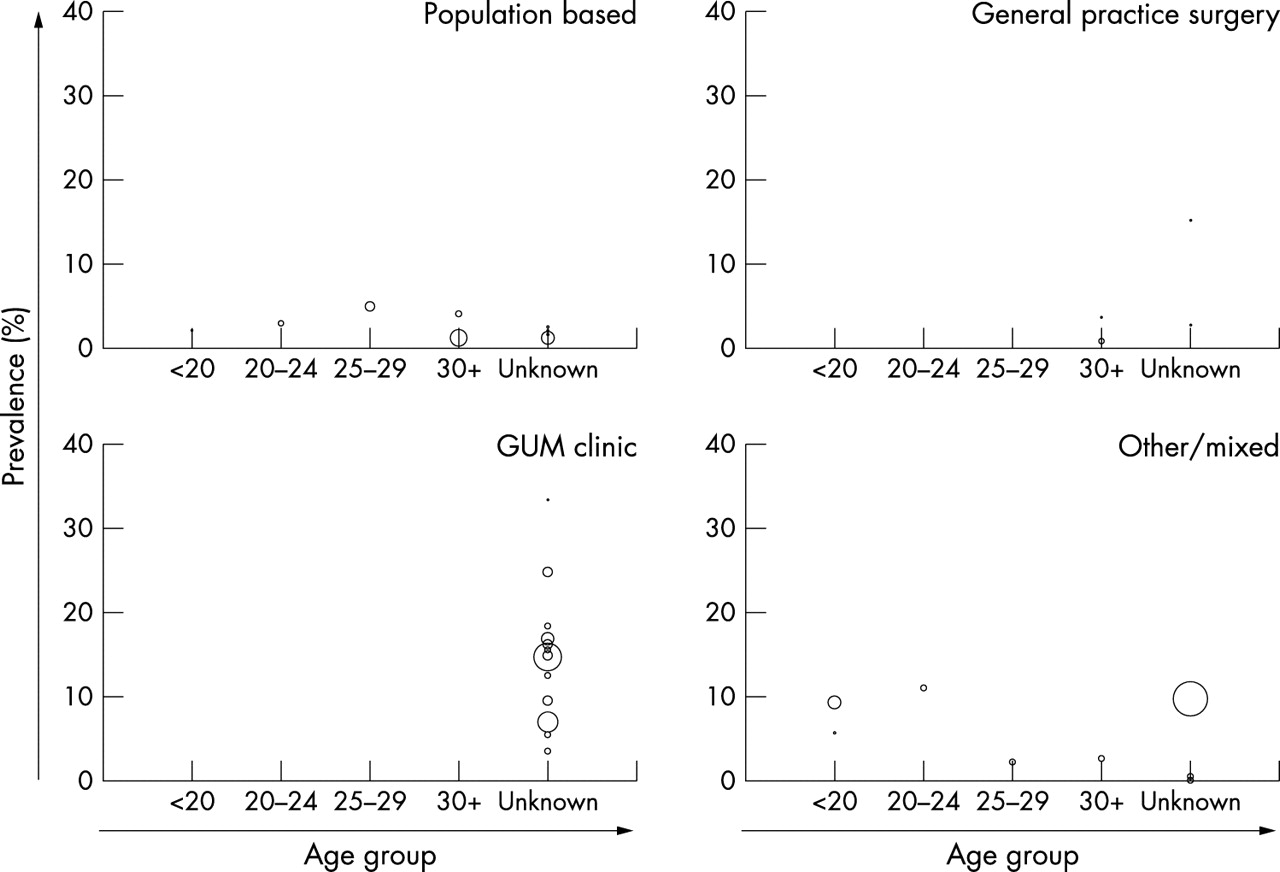
Selected studies varied and included those that investigated the prevalence in one specific population, changes in prevalence over time, differences in prevalence by age, prevalence comparisons among different geographical regions, large multicentre screening studies, and any combination thereof. Figure 1 shows reported prevalence in females from all studies, by setting and age group. Trends in prevalence by age group were consistent across settings, with those aged <20 years old having the highest prevalence in each setting. Many of the studies had missing data for one or more of the variables extracted, and nearly half of the studies had no usable information on patient age.

Reported and estimated chlamydia prevalence in females. Reported prevalence (clear bubbles) from all studies meeting the systematic review inclusion criteria, by setting and age group (irrespective of diagnostic test, specimen and date). Bubble size represents the size of the population tested (each population has a specific set of characteristics—for example, test, specimen, etc). Lines show the prevalence predictions from the final mixed model for the two significant predictors of prevalence, age group, and setting (%, 95% CI).
The majority of studies (84, 93%) were conducted in healthcare settings, the rest were postal surveys,13–16 door to door interviews,4 or in military recruits.17 Among the healthcare settings, most individuals (70%) were tested in general practice (GP) surgeries, FPC, or GUM clinics, and 6% of individuals were tested in TOP clinics (table 1 for a summary of observations and individuals included in the analysis). Studies were based on tests done between 1973 and 2002, with over half of the observations (63% of individuals) tested from 1995 to the present. Half of the individuals were tested using nucleic acid amplification tests and nearly a quarter with antigen tests.
Descriptive statistics of the studies identified in the literature search meeting inclusion criteria. Results are listed as number and percentage of the total, at both the study level and extracted patient level
The number of individuals tested in each study varied considerably, ranging between 2018 and 42 94419 individuals, with a mean of 593 and median of 180 people tested. Over 80% of the prevalence estimates were from females and about 11% from males (the others were unknown or mixed populations). The age groups were chosen to ensure that the maximum number of individuals tested in each study could be included in the analysis and that their results were informative. However, the majority of individuals tested did not fit into a distinct category or the age group was unknown (74% of individuals). Of the remaining 26% that fell into one of the age groups, 36% were aged less than 20 years, 37% were aged 20–24 years, 11% were aged 25–29 years, and 16% were over 30 years old.
Forty two per cent of studies reported information on the presence of symptoms among individuals tested. Studies reported excluding individuals with symptoms,20–22 the proportion of chlamydia positive individuals with symptoms,13,17,23–36 aggregate information on proportion of all patients with symptoms,37–39 and information on symptoms in both chlamydia positive and chlamydia negative individuals.23,40–53
There were 25 studies that reported the prevalence from males (table 2, fig 2). A total of 16 178 males were tested across all settings (population based, GP surgery, FPC, GUM and other settings). The ages of individuals tested were mainly unknown in GUM clinics, but varied in the other settings. Prevalence estimates ranged from 0% to 33%, and the crude mean prevalence estimate by setting was similar for that in females.
Male prevalence estimates. Extracted data and prevalence estimates (95% CI), by setting and age group
Reported and estimated chlamydia prevalence in males. Reported prevalence (clear bubbles) from all studies meeting the systematic review inclusion criteria, by setting and age group (irrespective of diagnostic test, specimen and date). Bubble size represents the size of the population tested (each population has a specific set of characteristics—for example, test, specimen, etc).
Regression models and prevalence estimates
In the final mixed effects and meta-analysis models with age and setting (female data only), 19 studies (21%) representing 32 188 individuals (22%) were included, comprising the studies in which all variables were known and coded. All of the population based data were from the NATSAL 2000 study,4 and 56% of the other settings were comprised of individual data from the Department of Health chlamydia pilot study.5
In the single variable analysis, all variables were associated with prevalence (p<0.05), (table 3). In the mixed effects model, where confounding effects of the other explanatory variables were accounted for, only age group and setting exhibited a strong association with prevalence (p<0.0001 and p = 0.002, respectively). The diagnostic test, specimen type, and date of testing did not exhibit an association with prevalence (p = 0.5, p = 0.09, p = 0.9 respectively). Table 3 gives the adjusted odds ratios and 95% CIs for all variables considered. In each setting, the females in the youngest age group (aged <20 years) had the highest prevalence, with the prevalence decreasing in each subsequent age group (table 4 and fig 1). For example, in GP surgeries, the prevalence estimates were 8.1% (95% CI 6.5 to 9.9) for <20 year olds, 5.2% (95% CI 4.3 to 6.3) for 20–24 year olds, 2.6% (95% CI 2.0 to 3.3) for 25–30 year olds, and 1.4% (95% CI 1.0 to 1.9) for >30 year olds. By setting the prevalence estimates also varied. For instance, among <20 year olds, estimates were 17.3% (95% CI 13.6 to 21.8) for GUM clinics, 12.6% (95% CI 6.4 to 23.2) for antenatal clinics, 12.3% (95% CI 9.8 to 15.3) for TOP clinics, 10.7% (95% CI 8.3 to 13.8) for youth clinics, and 10.0% (95% CI 8.7 to 11.5) for FPC. However, studies performed in GP surgeries also had an overall high chlamydia prevalence of 8.1% (95% CI 6.5 to 9.9) compared with 5.0% in population based studies (95% CI 3.2 to 7.6). Sensitivity analysis from the quadrature check of the final mixed model showed that the maximum relative difference in the parameters was 1.0×10⁻¹⁰ and all of the other parameters were less than that (meaning that the number of quadrature points chosen does not affect the reliability of the estimate). A global test for interactions of age and setting gave no strong evidence for an interaction (p = 0.44). The results from the meta-analysis for females only were similar to the logistic regression model results and are given in table 4.
Crude and adjusted odds ratios (OR) and 95% CI for the single and multiple variable models, for females only
Results from the random effects model and the meta-analysis, for females only, by age group and setting (%, 95% CI), and the crude overall mean and references from data included in each setting
The prevalence estimates from the final model appear to be a reasonable fit to the extracted data (including those that were not used to predict the model), for all settings except for population based studies. This setting did not appear to have such strong decreasing prevalence trends with age (figs 1 and 2), although there was not enough evidence with the available data to explore an age-setting interaction. Therefore, the model results (and 95% CIs) of 4.9% (3.2 to 7.6), 3.2% (2.1 to 4.9), 1.5% (1.0 to 2.5), and 0.8% (0.5 to 1.3) for females aged <20 years, 20–24 years, 25–29 years, and 30+ years respectively, are slight overestimates for those aged under 25 years, and slight underestimates for those aged over 25 years compared to the NATSAL data (3.8% (1.0 to 9.5), 2.7% (1.1 to 5.5), 2.2% (0.9 to 4.5), and 0.9% (0.4 to 1.6) in the respective age groups). However, the 95% confidence estimates from the NATSAL raw data are very wide and overlapping with the 95% CI from the model. The crude prevalence estimates by setting for just those studies included in the mixed effects model (table 4) were similar to the estimates from the literature review of all female studies in certain settings: population based, youth clinic, TOP and antenatal clinics, but slightly higher for GP surgeries, FPC, and GUM (appendix). Therefore, excluding studies with incomplete data appeared to slightly affect certain estimates, but not all.
DISCUSSION
Review of findings
This is the first systematic review of chlamydia prevalence in the United Kingdom. It has revealed a large degree of heterogeneity in the sampling and testing methods used in chlamydia prevalence studies. The regression methods gave insight into the most important variables predicting chlamydia prevalence in these studies, and provided estimates of chlamydia prevalence for females among different groups. The results highlight the high prevalence in younger age groups and certain clinical settings, regardless of other factors, and also the few data available on the prevalence of chlamydia in men.
Many variables appeared to have little impact on overall prevalence estimates. Neither diagnostic test nor specimen were apparently associated with the estimated female prevalence. While high test sensitivity and specificity are important to minimise false positive and false negative test outcomes, testing methodology does not appear to have a large impact on overall chlamydia prevalence estimated here. However, the test and specimen were the same (nucleic acid amplification, urine) within all studies, except for one, included in the regression analyses.
The majority of studies included in the analysis were conducted in health care settings. This is often the most practical and feasible way to obtain prevalence estimates because test acceptability is generally high among individuals presenting for other health related reasons, especially when offered a non-invasive urine test,73 and testing is facilitated within the existing clinic infrastructure. Of the 30% of studies that reported the proportion of individuals that accepted chlamydia testing, a higher proportion of individuals accepted testing in GP surgeries compared to population based studies (crude mean of 82% (range 45%–99%) and 46% (range 29%–71%) respectively). This suggests that there may have been less participation bias in reported estimates from GP surgeries than in the general population surveys. However, it is unknown if the individuals who accepted testing were representative of individuals from those populations, or if they were different, and therefore the extent of any selection bias.
Notwithstanding, these results indicate that prevalence in healthcare settings is, in general, higher than in population based studies. This difference may be due to individuals at a higher risk of infection attending healthcare settings. For example, in a recent chlamydia screening pilot study nearly 40% of females who accepted opportunistic screening listed contraception as the main reason for attendance at a variety of healthcare settings.73 Therefore, this might represent a more sexually active population than those tested in non-healthcare settings. Sexual behaviour data were not available from most studies and were not included in the analyses, but might be a good marker of infection as indicated by the NATSAL data.4
The presence of genital symptoms may be another reason for higher chlamydia prevalence among healthcare setting attendees. For example, in the pilot screening study 8% of individuals tested listed genital tract symptoms as the primary reason for attending the clinic.73 This information was not consistently reported among the studies identified in the literature search, and in those included in the regression model only four studies included the proportion of positive and negative individuals with symptoms.40,41,50,51 However, this information might be a potentially useful means of comparing the groups and may be a factor affecting the differences in prevalence, especially in non-healthcare settings.
Implications of these results
Results from these models can help inform policy on chlamydia screening. As chlamydia screening is rolled out to more sites across England as proposed in the National Sexual Health and HIV Strategy for England,2,3 the results from this analysis strongly support the need for high coverage in younger age groups. However, this study also highlights particularly high prevalence among attenders agreeing to be screened in GP surgeries, a setting that has not been given a high priority in the current screening policy.74 Since the GP is the first point of contact with the health system for most individuals, with 70% of males and 90% of females under 35 years old in England attending a GP surgery each year,75 screening in this setting would be an effective way of identifying and treating large numbers of chlamydia positive individuals. The results of this study suggest that testing in FPC, TOP clinics, youth clinics, and GUM clinics would yield many positive individuals.
This analysis did not include male data. Figure 2 shows that there are very few studies reporting prevalence data in males, and the studies that are included generally have a small sample size and are not stratified by age. However, from the crude overall prevalence based on the available data in limited settings, the prevalence may be as high as that in females, although the peak in prevalence may occur at a later age.1 The current approach is to identify infected males through partner notification of positive females. However, this might not be occurring effectively enough in practice and screening males might need to be considered for a national chlamydia screening programme.76 This review highlights the scarcity of male prevalence data. Further studies on prevalence in males may help elucidate the burden of infection in this group, and help inform the current debate on screening men.
Estimating the effectiveness of a chlamydia screening strategy will rely heavily on prevalence in the general population and specific subpopulations. Likewise, with limited resources in a government funded intervention, modelling the cost effectiveness of various screening strategies requires prevalence estimates and confidence intervals, which can be exploited further in sensitivity analyses.
Key messages
-
This study presents the first systematic review and analysis of chlamydia prevalence studies in the United Kingdom. It explores the important determinants of chlamydial infection, and provides estimates of the prevalence for various populations
-
The results highlight the high prevalence among younger age groups and in clinical settings. The choice of test and specimen, and the date of testing were not strongly associated with chlamydia prevalence. There is also a paucity of data on prevalence in males and in the general population in the United Kingdom
-
These prevalence estimates can be used to inform chlamydia screening strategies
Methodology issues and further research
The approach we used allows the associations between predictors and prevalence to be explored. The estimations from this analysis are based purely on reported studies, and there may be some bias from the initial literature review from oversampling in certain populations. In particular, as with prevalence in males, there is a paucity of prevalence data from the general population as well. The results of another large ongoing chlamydia screening study (ClaSS, funded by the NHS Health Technology Assessment Programme)77 were unavailable to include in this analysis, but are due to provide more data on chlamydia prevalence in the general population when they are published.
The results from the meta-analysis were very similar to those of the logistic regression model, as would be expected. Unlike the meta-analysis techniques used for randomised controlled trials in which stringent inclusion criteria can be defined based on study methodology, it is difficult to do this with observational studies such as the ones presented in this analysis. Since the estimates obtained are from such studies, they may be prone to biases. While all studies reported on the test setting, other variables were often missing, and therefore contribute to uncertainty in the interpretation of results.
One of our implicit inclusion criteria for the final model was that a study must have extractable data for age group and setting. While much information was lacking, 19 studies (21% of the total identified in the systematic review) still had sufficient data to include them in the logistic regression model and meta-analysis. More data might contribute additional information and be added to models (for example data from males and the general population). Ideally, these would be from well designed studies with specific information about the individuals tested (and those not tested), and information about age, screening methodology, presence of symptoms, and sexual behaviour.
A large amount of methodological heterogeneity was revealed in chlamydia prevalence studies from the United Kingdom. There are few data from specific populations such as men and the general population. A model based on extracted data from the studies identified in the literature review provided prevalence estimates that may be used to inform chlamydia screening strategies. Results indicate clear trends of a high prevalence in younger age groups that decreases with increasing age across settings, and prevalence differences by setting.
Acknowledgments
Many thanks to the following individuals who provided additional published and unpublished results from prevalence studies and who offered helpful suggestions: Syed Ahmed, Anona Blackwell, Bill Carmen, Linda Dicker, Kevin Fenton, David Goldberg, Emma Honey, Anne Johnson, Susan Logan, Harry Mallinson, Philippe Mayaud, Catherine Mercer, Timothy Moss, Jane Norman, Ahilya Noone, Pippa Oakeshott, Gillian Penney, Jeanne Pimenta, Chris Redman, Karen Rogstad, Paul Schober, Gordon Scott, Chris Sonnex, Tim Stokes, Allan Templeton, and Andrew Winter. Special thanks to Pauline Rogers of the PHLS for her statistical help and advice.
CONTRIBUTORS EJA, WJE, and GH participated in the study planning and design; EJA conducted the systematic review and data extraction; AC and EJA planned the analysis; and AC and EJA conducted the statistical analysis; EJA was the lead writer; and all authors provided revision and commented on the paper.
REFERENCES
Supplementary materials
Web-only Appendix The appendix is available as a downloadable PDF (printer friendly file).
If you do not have Adobe Reader installed on your computer,
you can download this free-of-charge, please Click hereFiles in this Data Supplement:
- [View PDF] - Appendix 1: All studies that met the systematic review inclusion criteria, their extracted variables and computed prevalence (%, 95% CI), based on the reported number tested and positive.